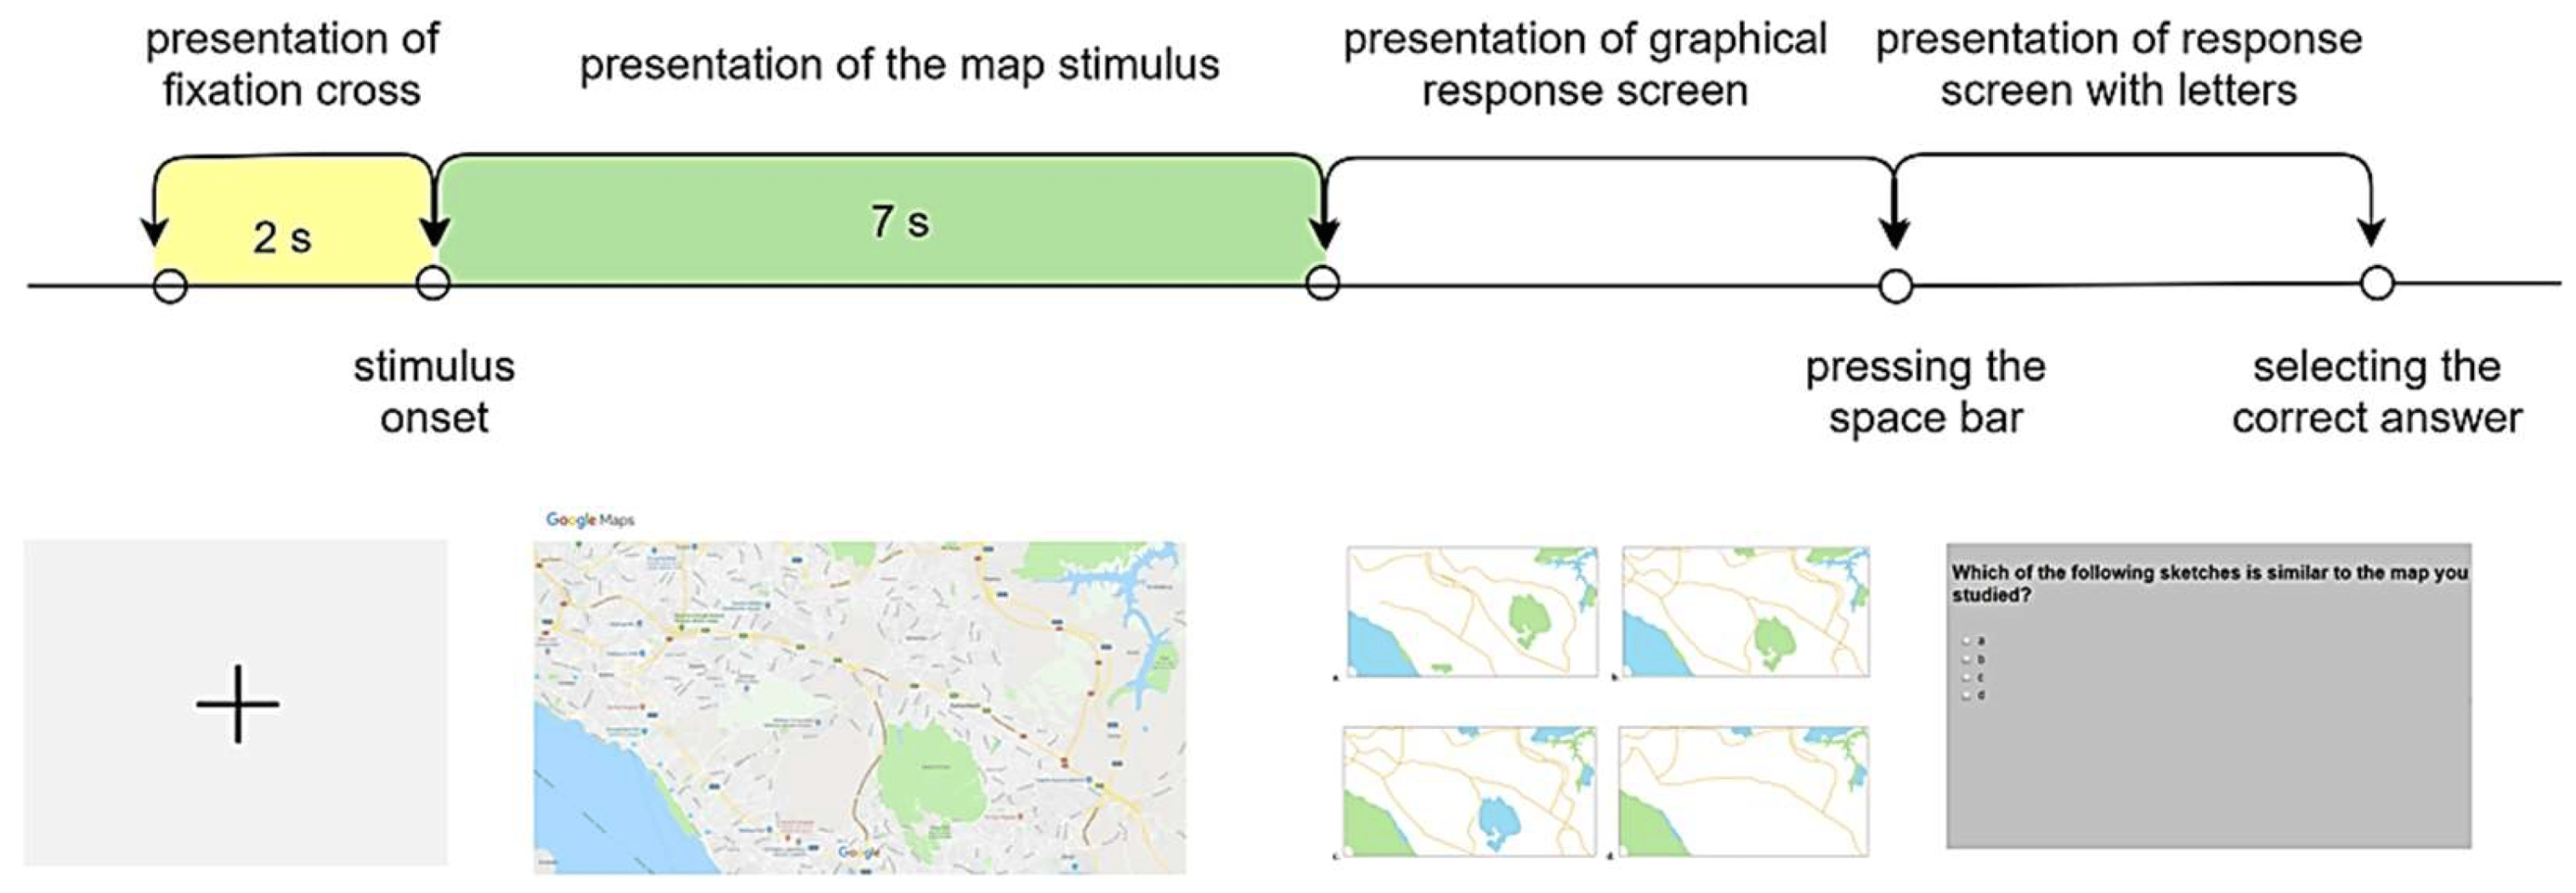
Introduction

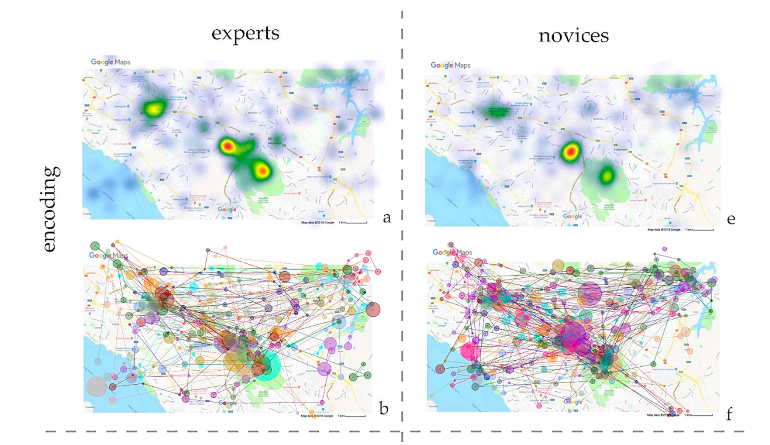
Welcome to the MAP-VERSE: MAP usability - Validated Empirical Research by Systematic Evaluation! We are building a unique data discovery repository dedicated to advancing empirical research in map usability and spatial cognition. Our goal is to foster open science and collaboration by creating a centralized, queryable repository for metadata from open-access map usability studies through a living collection of publicly shared datasets recorded during geospatial tasks such as map reading, navigation. By this way, we strive to

encourage standardized reporting of user studies (minimum reporting standards)

showcase best practices in map reading studies

increase generalizability and reproducibility of findings

This repository acts as a queryable metadata repository for open-access eye tracking, neuroimaging (EEG, fMRI), and human sensing (EDA, cardiovascular activity, skin temperature) datasets recorded during geospatial tasks, a.k.a. map reading user studies. The links to open datasets shared elsewhere (e.g., zenodo, harvard dataverse)

CartoGAZE

Visual Attention and Recognition Differences Based on Expertise in a Map Reading and Memorability Study

Abstract

This study investigates how expert and novice map users’ attention is influenced by the map design characteristics of 2D web maps by building and sharing a framework to analyze large volumes of eye tracking data. In this context, we developed an automated area-of-interest (AOI) analysis framework to evaluate participants’ fixation durations, and to assess the influence of linear and polygonal map features on spatial memory. The dataset entitled CartoGAZE is publicly available.

Full citation (dataset) with DOI

Keskin, Merve, 2023, “CartoGAZE”, https://doi.org/10.7910/DVN/ONIAZI, Harvard Dataverse, V1

Keskin M, Krassanakis V, Çöltekin A. Visual Attention and Recognition Differences Based on Expertise in a Map Reading and Memorability Study. ISPRS International Journal of Geo-Information. 2023; 12(1):21.

https://www.mdpi.com/2220-9964/12/1/21

/Repository/img/img02_01.jpg
/Repository/img/img02_02.jpg

EyeCatchingMaps

EyeCatchingMaps, a Dataset to Assess Saliency Models on Maps

Abstract

Saliency models try to predict the gaze behaviour of people in the first seconds of their observation of an image. To assess how much these models can perform to predict saliency in maps, we lack a ground truth to compare to. This paper proposes EyeCatchingMaps, an open dataset that can be used to benchmark saliency models for maps. The dataset has been obtained by recording the gaze of participants looking at different maps for 3 seconds with an eye-tracker. The use of EyeCatchingMaps is demonstrated by comparing two different saliency models from the literature to the real saliency maps derived from people’s gaze.

Full citation (dataset) with DOI

Wenclik, L., & Touya, G. (2024). EyeCatchingMaps, a Dataset to Assess Saliency Models on Maps [Data set]. Zenodo. https://doi.org/10.5281/zenodo.10619513

Wenclik, L. and Touya, G. (2024) EyeCatchingMaps, a Dataset to Assess Saliency Models on Maps, AGILE GIScience Ser., 5, 51, https://doi.org/10.5194/agile-giss-5-51-2024

https://agile-giss.copernicus.org/articles/5/51/2024/

/Repository/img/img05.jpg

EyeMouseMap

Quantifying map user response differences between gaze and cursor activity during searching cartographic point symbols

Abstract

The examination of both perceptual and cognitive issues related to map reading requires the performance of experimental procedures that aim to measure map user response under free viewing or task-oriented conditions. Map user reaction can be modeled by considering data collected utilizing several experimental techniques (e.g., reaction time and response accuracy measurements). However, it is of great importance to explore experimental frameworks that can be executed remotely. The present study aims to present a work in progress that aims to compare gaze and cursor activity during the execution of a typical map reading task. In more detail, we implement a lab-based experiment which concurrently captures both eye and (computer) mouse movements while searching for specific point symbols on cartographic backgrounds. The experiment is based on the use of the visual stimuli and point target symbols presented by Pappa & Krassanakis (2022). The aforementioned study was implemented utilizing remote (online) mouse tracking techniques. In the framework of the current work, the overarching goal is to explore quantitative measures that are able to describe individual and/or aggregated visual search behavioral differences. Considering the aggregated statistical grayscale heatmaps produced by both experimental studies, we plan to use the Jaccard index, the Dice coefficient and the BF score in order to perform comparisons between gaze and cursor activity, as well as between the mouse movement data produced under both conditions (lab-based and online). In addition, we will compute the GraphGazeD (Liaskos & Krassanakis, 2024) metric towards describing existing visual perception differences. The process of data analysis will be fully automatized using Python programming language and MATLAB software.

Full citation (dataset) with DOI

Vlachou, A., Pappa, A., Liaskos, D., & Krassanakis, V. (2024). EyeMouseMap [Data set]. Zenodo. https://doi.org/10.5281/zenodo.13929730

Vlachou A., Liaskos, D., & Krassanakis, V. (2024). Quantifying map user response differences between gaze and cursor activity during searching cartographic point symbols. Online User Experiments: Seeing What Map Users See without Seeing Them (Pre-conference Workshop, EuroCarto 2024). Available at: https://eurocarto2024.org/wp-content/uploads/2024/10/EC24_workshop_online-user-experiments_proceedings.pdf#page=9 Pappa, A., &

Krassanakis, V. (2022). Examining the preattentive effect on cartographic backgrounds utilizing remote mouse tracking. Abstracts of the ICA, 5, 111. (EuroCarto 2022 Conference). https://doi.org/10.5194/ica-abs-5-111-2022

https://doi.org/10.5194/ica-abs-5-111-2022

/Repository/img/img06.jpg

Fixations & Saccades metadata

Animating Cartographic Meaning - Unveiling the Impact of Pictorial Symbol Motion Speed in Preattentive Processing

Abstract

The primary objective of this study is to assess how the motion of dynamic point symbols impacts preattentive processing on a map. Specifically, it involves identifying the motion velocity parameters for cartographic animated pictorial symbols that contribute to the preattentive perception of the target symbols. We created five pictorial symbols, each accompanied by a unique animation tailored to convey the meaning associated with each symbol. The animation dynamics of symbols on the administrative map were distributed across arithmetic, logarithmic, and exponential scales. Eye-tracking technology was utilized to explain the user’s visual attention. The key findings reveal that, although movement does not uniformly hold the same designation in cartographic communication, it could guide user attention to identify the value peaks in quantitative map visualization. Motion velocity enhances the salience of animated symbols, making them stand out, not only against static elements but also against other animated distractors. Additionally, motion distributions between symbol classes based on exponential or arithmetic scales were identified as the most successful. Nevertheless, certain types of motion, such as rotational, do not perform well with pictorial symbols, even on the most effective motion distribution scale.

Full citation (dataset) with DOI

Cybulski, Paweł, 2023, “Fixations & Saccades metadata (NCN SONATA 16 “Preattentive attributes of dynamic point symbols in quantitative mapping”)”, https://doi.org/10.7910/DVN/YHYXLI, Harvard Dataverse, V1

Cybulski P. Animating Cartographic Meaning: Unveiling the Impact of Pictorial Symbol Motion Speed in Preattentive Processing. ISPRS International Journal of Geo-Information. 2024; 13(4):118. https://doi.org/10.3390/ijgi13040118

https://www.mdpi.com/2220-9964/13/4/118

/Repository/img/img09.jpg

GeoEye

BNU500 A geospatial image based eye movement dataset for cartography and GIS

Abstract

A geospatial image-based eye movement dataset called GeoEye, a publicly shared, widely available eye movement dataset. This dataset consists of 110 college- aged participants who freely viewed 500 images, including thematic maps, remote sensing images, and street view images, which could use for geospatial image saliency prediction and map user identification.

Full citation (dataset) with DOI

HE, ICE (2021). GeoEye dataset. figshare. Dataset. https://doi.org/10.6084/m9.figshare.14684214.v4

He, B., Dong, W., Liao, H., Ying, Q., Shi, B., Liu, J., & Wang, Y. (2023). A geospatial image based eye movement dataset for cartography and GIS. Cartography and Geographic Information Science, 50(1), 96–111. https://doi.org/10.1080/15230406.2022.2153172

https://www.tandfonline.com/doi/full/10.1080/15230406.2022.2153172

/Repository/img/img01.jpg

Map activities recognition

Recognition of map activities using eye tracking and EEG data

Abstract

Recognizing the activities being performed on a map is crucial for adaptive map design based on user context. Despite eye tracking (ET) demonstrating potential in recognizing map activities and electroencephalography (EEG) measuring map users’ cognitive load, no studies have yet combined ET and EEG for recognition of the user’s activity on maps. Our study collected participants’ ET and EEG data during four types of map activities. After feature extraction and selection, we trained LightGBM (light Gradient-Boosting Machine) to classify these activities, and achieved 88.0% accuracy when combining ET and EEG features in the entire map usage trial, which is higher than using ET (85.9%) or EEG (53.9%) alone. Acceptable recognition accuracy could also be achieved with the early time windows (73.1% when using the first 3 seconds). Saccade features of ET were the most important for differentiating map activities, indicating selective map content for different tasks. Our findings demonstrate the feasibility and advantages of combining ET and EEG for activity recognition in map use. The results not only improve our understanding of visual patterns and cognitive processes in map use, but also enable the design of adaptive maps that can automatically adapt to the activities a map user is performing.

Full citation (dataset) with DOI

Qin, Tong; Fias, Wim; Weghe, Nico Van de; Huang, Haosheng (2023). Map activity recognition dataset. figshare. Dataset. https://doi.org/10.6084/m9.figshare.23805027.v2

Qin, T., Fias, W., Van de Weghe, N., & Huang, H. (2024). Recognition of map activities using eye tracking and EEG data. International Journal of Geographical Information Science, 38(3), 550–576. https://doi.org/10.1080/13658816.2024.2309188

https://www.tandfonline.com/doi/full/10.1080/13658816.2024.2309188

/Repository/img/img07.jpg

MDHScomplexity

Evaluating the perceived visual complexity of multidirectional hill-shading

Abstract

Eye tracking recordings could reveal the visual behavior for different carto- graphic visualization techniques, such as hill-shading, while at the same time eye track- ing metrics (ETMs) can summarize the associated complexity levels in a concise and quantitative manner. In the present study, three different hill-shading methods, including: (i) the standard method based on ideal diffuse reflection, (ii) the Multidirectional Oblique- Weighted method – MDOW and (iii) the combination of a MDOW’s variation with stan- dard hill-shading, are evaluated and ranked in terms of their perceived visual complexity. The performed examination is based on both eye tracking techniques and expert judgement procedures. A weighted combination of basic ETMs has been used, implemented by the Landscape Rating Index – LRI. The weights resulted from an experts’ judgement process where the opinions of experts in geoinformatics, cartography, geovisualization, experimen- tal psychology, cognitive science, neuroscience and eye tracking were analyzed. Fifteen (15) individuals participated in an eye tracking experiment with hill-shading images produced by the three methods under evaluation, while 41 experts participated in an online questionnaire in order to collect all the analysis data. The final evaluation was based on the computation of three LRI models. The outcomes indicate that implementing hill-shading with more than one light sources results in similar perceptual behaviors, allowing for a seamless exploita- tion of the advantages of using multidirectional illumination.

Full citation (dataset) with DOI

Tzelepis, N., Krassanakis, V., Kaliakouda, A., Misthos, L.-M., & Nakos, B. (2020). MDHScomplexity (Version v1) [Data set]. Zenodo. https://doi.org/10.5281/zenodo.14680770

Tzelepis, N., Kaliakouda, A., Krassanakis, V., Misthos, L. M., & Nakos, B. (2020). Evaluating the perceived visual complexity of multidirectional hill-shading. Geodesy and Cartography, 69(2), 161-172. https://doi.org/10.24425/gac.2020.131085

http://users.ntua.gr/niktzel/gc_paper_data.zip

/Repository/img/img04.jpg

OnMapGaze

OnMapGaze and GraphGazeD - A Gaze Dataset and a Graph-Based Metric for Modeling Visual Perception Differences in Cartographic Backgrounds Used in Online Map Services

Abstract

In the present study, a new eye-tracking dataset (OnMapGaze) and a graph-based metric (GraphGazeD) for modeling visual perception differences are introduced. The dataset includes both experimental and analyzed gaze data collected during the observation of different cartographic backgrounds used in five online map services, including Google Maps, Wikimedia, Bing Maps, ESRI, and OSM, at three different zoom levels (12z, 14z, and 16z). The computation of the new metric is based on the utilization of aggregated gaze behavior data. Our dataset aims to serve as an objective ground truth for feeding artificial intelligence (AI) algorithms and developing computational models for predicting visual behavior during map reading. Both the OnMapGaze dataset and the source code for computing the GraphGazeD metric are freely distributed to the scientific community.

Full citation (dataset) with DOI

Liaskos D, Krassanakis V. OnMapGaze and GraphGazeD: A Gaze Dataset and a Graph-Based Metric for Modeling Visual Perception Differences in Cartographic Backgrounds Used in Online Map Services. Multimodal Technologies and Interaction. 2024; 8(6):49. https://doi.org/10.3390/mti8060049

Keskin M, Krassanakis V, Çöltekin A. Visual Attention and Recognition Differences Based on Expertise in a Map Reading and Memorability Study. ISPRS International Journal of Geo-Information. 2023; 12(1):21.

https://www.mdpi.com/2414-4088/8/6/49

/Repository/img/img03.jpg

Rymarkiewicz et al. (2024)

Measuring Efficiency and Accuracy in Locating Symbols on Mobile Maps Using Eye Tracking

Abstract

This study investigated the impact of smartphone usage frequency on the effectiveness and accuracy of symbol location in a variety of spatial contexts on mobile maps using eye-tracking technology while utilizing the example of Mapy.cz. The scanning speed and symbol detection were also considered. The use of mobile applications for navigation is discussed, emphasizing their popularity and convenience of use. The importance of eye tracking as a valuable tool for testing the usability of cartographic products, enabling the assessment of users’ visual strategies and their ability to memorize information, was highlighted. The frequency of smartphone use has been shown to be an important factor in users’ ability to locate symbols in different spatial contexts. Everyday smartphone users have shown higher accuracy and efficiency in image processing, suggesting a potential link between habitual smartphone use and increased efficiency in mapping tasks. Participants who were dissatisfied with the legibility of a map looked longer at the symbols, suggesting that they put extra cognitive effort into decoding the symbols. In the present study, gender differences in pupil size were also observed during the study. Women consistently showed a larger pupil diameter, potentially indicating greater cognitive load on the participants.

Full citation (dataset) with DOI

Horbiński, Tymoteusz, 2024, “Efficiency and accuracy in locating symbols within diverse spatial contexts on mobile maps using eye-tracking technology on the example of the Mapy.cz”, https://doi.org/10.7910/DVN/DZUFJ1, Harvard Dataverse, V1

Rymarkiewicz W, Cybulski P, Horbiński T. Measuring Efficiency and Accuracy in Locating Symbols on Mobile Maps Using Eye Tracking. ISPRS International Journal of Geo-Information. 2024; 13(2):42. https://doi.org/10.3390/ijgi13020042

https://www.mdpi.com/2220-9964/13/2/42

/Repository/img/img08.jpg